“Sequencing peaks show each base called during the sequencing process, however, the shape, size, color and height may vary. Why is this so? Let’s find out.”
Sanger sequencing results are analyzed using the technique known as capillary gel electrophoresis. It can distinguish even a single nucleotide change within the sequence.
The automation and the fluorescent chemistry in the Sanger sequencing capillary electrophoresis allow accurate determination of each nucleotide. Bases/nucleotides emit fluorescence, which the detector detects and converts into sequence signals.
You can observe the results in the form of nucleotides and peaks. If you have seen any of the Sanger sequencing plates, you know the peaks, Right?
But you may have questions- why each peak has a different color, and why the height, shape and size differ. In this article, I will explain only the Sanger sequencing peaks!
An entire article is on just sequencing peaks! Sounds crazy, isn’t it?
We just started a fresh new series of Sanger sequencing results and analysis and this is the first article of this series.
Stay tuned!
Key Topics:
What are the peaks in the Sanger sequencing electropherogram?
Sanger sequencing electropherogram is an electrical version of the nucleotide sequence generated by computer software using the sequencing reaction data.
The key highlight and important metric “to analyze”, here is the different colored peaks. Each peak represents a single base call. By looking at the peaks, the sequencing results can be visually validated.
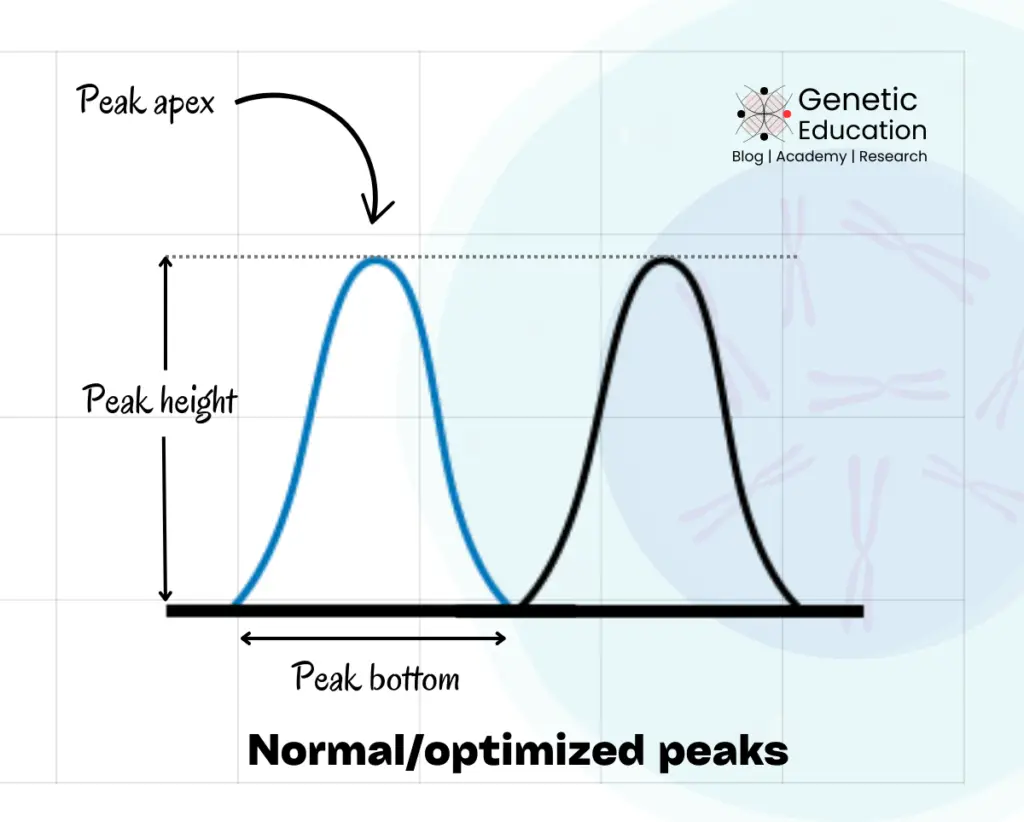
The shape, size and height of sequencing peaks vary based on various factors. A normal peak is considered a well-optimized peak; showing a decent height, defined shape and sharp apex.
It also has lower background noise, manifesting a robust signal-to-noise ratio.
How Peaks are generated during sequencing?
Each chain-terminated fragment contains ddNTP at the terminal end. That’s our ‘base or nucleotide’ read during the analysis. The ddNTP is labeled with a fluorescent tag. During the CE (Capillary electrophoresis), when the fragment reaches the end, the fluorescent tag is removed, and the fluorescence is released and detected.
Depending on the color emitted from the fluorescent tag, the nucleotide is read. Now, based on the amount of fluorescent emission, the software generates a peak. Similarly, different peaks are generated for all the fluorescence signals.
Why do peaks have different colors?
You observe four different colored peaks for four different nucleotides in the software– Green for A, Red for T, Blue for C and Black for G. Literature usually suggests that four different fluorescent dyes are used to label four different ddNTPs.
That we already discussed here. Different peak colors signify different bases or nucleotides. This will make analysis visually easy.
Peak size, width, shape and height:
The peak size is one of the important criteria for results and analysis. I am talking about the bottom width of peaks. Usually, every peak has a similar width on the bottom. Too short and too wide peak-bottom could be a sequencing anomaly.
(Check out the above image).
As aforementioned, each peak should have a symmetrical shape with a decent heightened apex and well-defined peak body and bottom. In addition, it should have a “nearly” sharp tip or apex. Smiling, distorted and dye blob peaks show abnormal shape and size.
Peak height is further considered a pivotal factor in understanding the sequencing results. But you may have a question, why does peak size vary among peaks?
Why does peak height differ?
Peak height in the Sanger sequencing is represented as the vertical length of each peak. Although there are no predefined criteria to examine the peak height, it should be decent enough to investigate the results.
Too high and too low peak sizes represent abnormality in the sequencing process. In addition, lower peak height can be confused with the background noise and hurdle in the results and analysis.
Now, coming to the question, why does peak height vary?
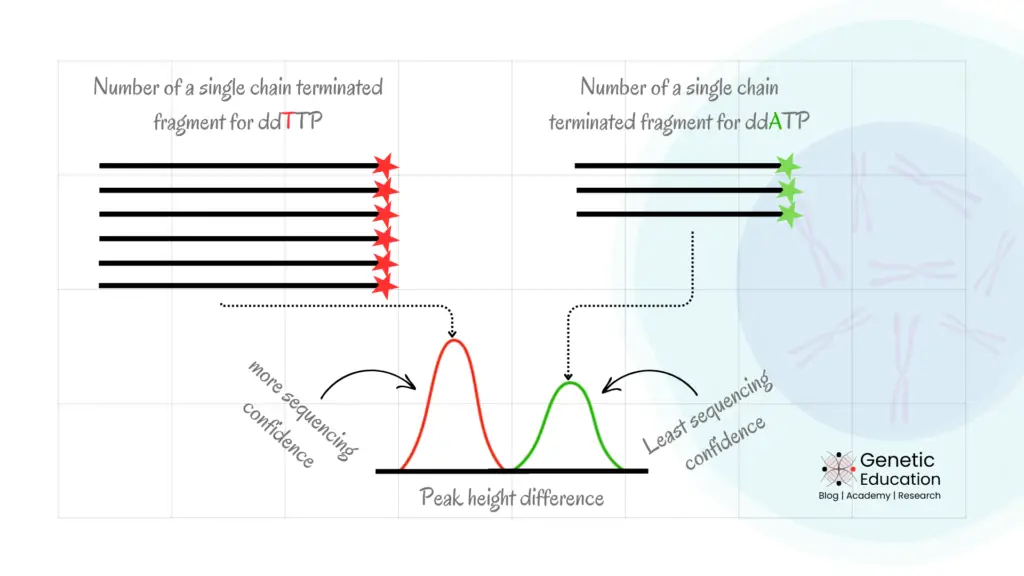
Peak height represents the amount of fluorescence emitted during the CE, which means the amount of chain-terminated fragments prepared. Meaning, the more the number of chain-terminated fragments for a ddNTP, the higher the peak height!
As simple as that!
Therefore, to generate a decent heightened peak we need to amplify the template region in higher amounts so that each ddNTP can generate a sufficient number of chain-terminated fragments.
Now, here is a catch!
And that’s too technical, indeed.
Studying low abundant mutation (mutation with low copy number) generates a short peak height for that mutation, no matter if it is homozygous or heterozygous.
Pro tip:
Two completely overlapping peaks represent germline heterozygous or double infection.
Some common points to remember:
| Key questions | True/false |
| Is the height of all peaks the same? | Not necessary |
| Is the bottom width of all peaks the same? | Almost |
| Does the peak height demonstrate the base calling quality? | No |
| Different heighted peaks means, different base call | Absolutely no |
| Smaller peaks mean bad quality base call | Not necessary |
| The base called and peak are alway correct | No (sometimes we need to correct it) |
- A Beginner’s Guide to Sanger Sequencing Results [Before Electropherogram Analysis]
- 4Peaks Review: Easiest Sequence Analysis Software
- Advantages and Limitations of Sanger Sequencing
- Detailed History of DNA Sequencing
- Why Should Life Science Students Learn Sanger Sequencing? – Top 6 Reasons
Wrapping up:
For beginner’s it is important to understand the Sanger sequencing peaks concept comprehensively to well-establish themself as a sequencing expert. However, to gain deeper understanding and expertise, you need more knowledge regarding various types of peaks as well.
In the next articl, I will show you and explain various types of peaks that you possibly observe in Sanger sequencing results. I hope you like this article. If so, do share it and subscribe to the Genetic Education blog.
To learn more about sequencing, you can also join our online classes where we explained so many such things! You can join it from here: Sanger Sequencing Mastery Course.
Source:
Al-Shuhaib, M.B.S., Hashim, H.O. Mastering DNA chromatogram analysis in Sanger sequencing for reliable clinical analysis. J Genet Eng Biotechnol 21, 115 (2023). https://doi.org/10.1186/s43141-023-00587-6.