In the present article, we will analyze and interpret agarose gel electrophoresis results of restriction digestion, circular DNA, linear DNA, supercoiled DNA and multiplex PCR.
After the great success of our previous article, A complete guide for analysing and interpreting gel electrophoresis results, we are continuing this series with another article on it.
Because of the tremendous response given by you, the article ranked first on Google with more than 1500 monthly visitors.
After that, we had done some research, ran gels of different DNA products and collected all the information for you.
In the present article, we will give you a pictorial guide for the interpretation of agarose gel electrophoresis results of a different form of DNA and product of DNA digestion along with some images of multiplex PCR results.
The agarose gel electrophoresis is a molecular genetic technique used to separate DNA on the basis of size and charge of it.
The negatively charged DNA migrates towards the positive node under the influence of the current.
The results of agarose electrophoresis are affected by some of the factors enlisted below,
- The concentration of gel
- Re-use of chemicals and solutions
- Unpure DNA samples
- Concentration of buffer
- The concentration of agarose gel
Due to these reasons, the different type of unusual DNA bands appearing in the gel hinder in the interpretation.
Now let’s get into the topic,
Key Topics:
Analyzing and Interpreting (Agarose) Gel Electrophoresis Results of Restriction Digestion:
The restriction digestion is a process in which the restriction enzyme cleaves a DNA at a specific location (called recognition site).
Different fragments of DNA generated due to restriction digestion used to distinguish homozygous from heterozygous.
See the Figure below,
Figure 1:
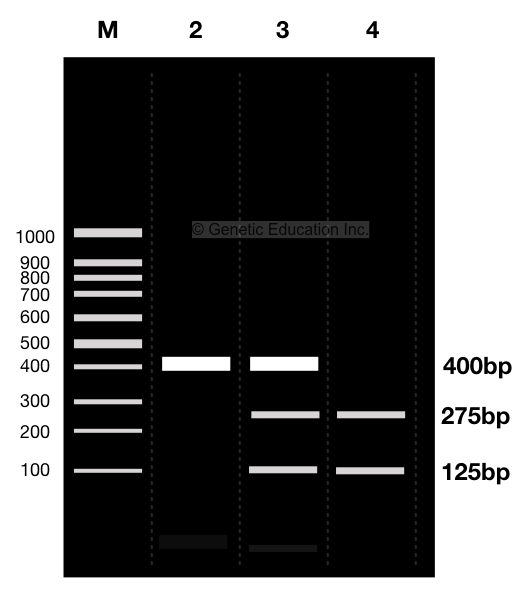
The figure shown above is the hypothetical representation of restriction digestion.
A restriction endonuclease enzyme cuts the DNA at a specific location(at its recognition site on DNA) and creates two fragments of it, the process is called restriction digestion.
Our writer had written an article on restriction digestion which contains all the information regarding it. Please read it here: What is Restriction Digestion and how to do it?
More than two fragments of DNA are obtained due to the presence of more than one recognition site on that DNA.
Heterozygous and homozygous can be characterized by doing restriction digestion.
For instance, Suppose We have a 400bp long DNA when it digested, it creates two fragments of 125bp and 275bp. The other one remains uncut having the size of 400bp, see the figure above.
Here, lane 2 is a homozygous mutant allele that does not contain restriction site and remains uncut, while the lane 4 is a homozygous normal allele contains one restriction site and generates two different fragments of 125bp and 275bp after digestion.
Lane 3 is heterozygous contains both normal as well as a mutant allele, therefore, it shows all three bands, one 400bp band of ( homozygous mutant allele) and two 125 and 275bp bands (of normal allele).
Lane 1 is a molecular marker.
Now analyze above figure carefully.
[epcl_box type=”notice”]Remember!! The total size of the digested product must be equal to the size of the uncut allele. (125bp + 275bp = 400bp) [/epcl_box]
Figure 2:
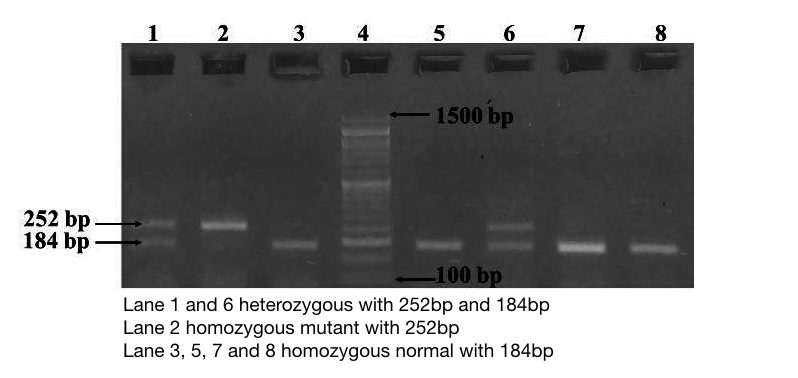
Now let see some real images.
The gel image above is the result of restriction digestion. Lane 3, 5, 7, and 8 are a homozygous normal allele with a 184bp band here one band of 68bp is also present, but it is not visible.
Lane 2 is a mutant uncut allele of 252bp.
Lane 1 and 6 are heterozygous contain three alleles: 252bp, 184bp and 68bp. However, it is difficult to distinguish the 64bp band, because, the concentration of gel lower than 3%.
If the concentration of gel was 3%, more sharpen bands will be seen and maybe the 64bp band will appear.
Lane 4 is a molecular marker.
Figure 3:
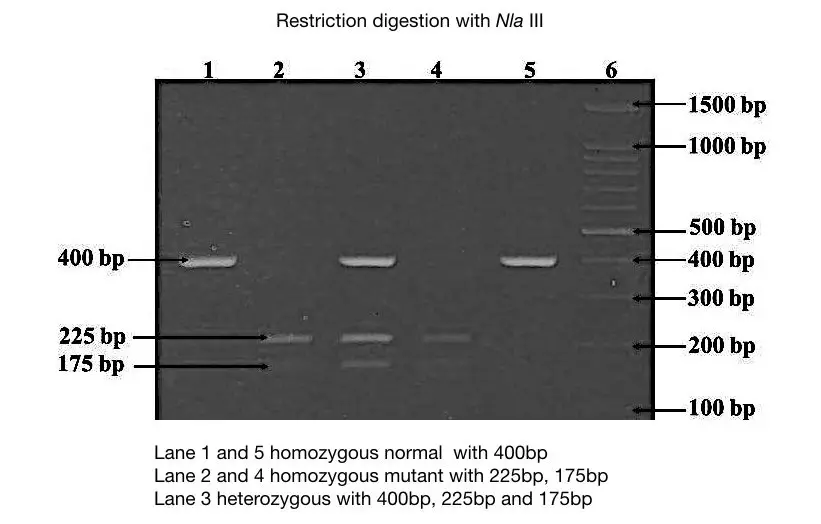
The figure above is another example of the restriction digestion of DNA with Nia III endonuclease. Here the scenario of the digestion is different.
Instead of a normal allele, a mutant allele contains a restriction site for the Nia III which cuts the mutant allele and produces two DNA fragments of 225bp and 175bp.
The normal allele remains uncut of 400bp. Examine the figure carefully.
Figure 4:
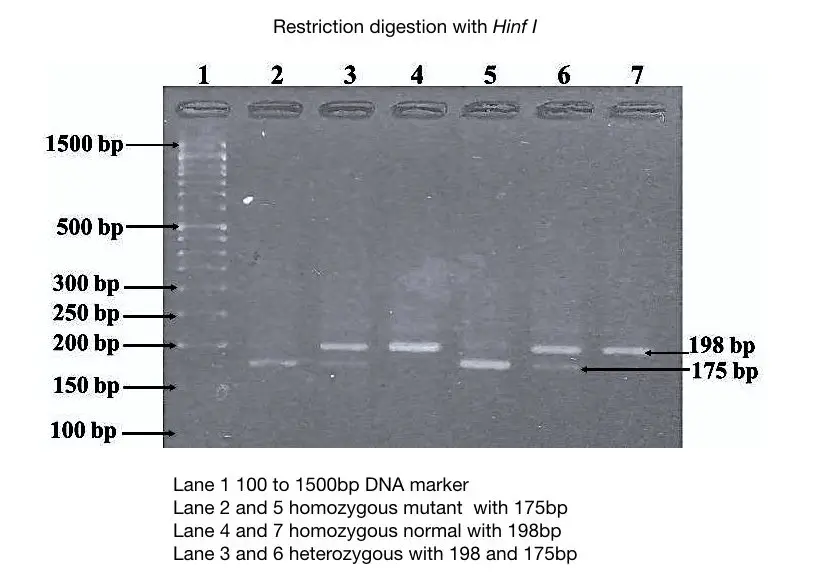
In this gel image, the mutant allele digested with Hinf I generates two alleles of 175bp and 23bp. However, the 23 bp band does not appear in the gel due to the lower concentration of gel.
The specification of the normal allele and mutant alleles are given into the figure 4.
Figure 5:
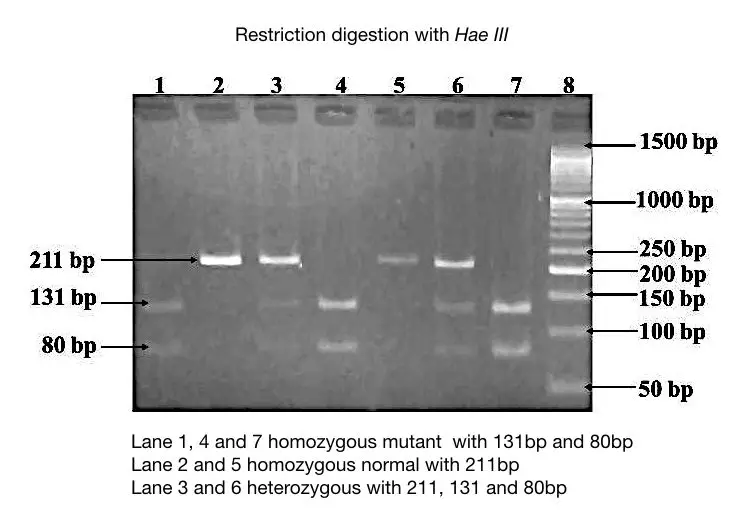
This gel image is another example of in which instead of the normal allele, the mutant allele is digested using the HaeIII enzyme. The specification of normal and mutant alleles are given into the figure.
Figure 6:
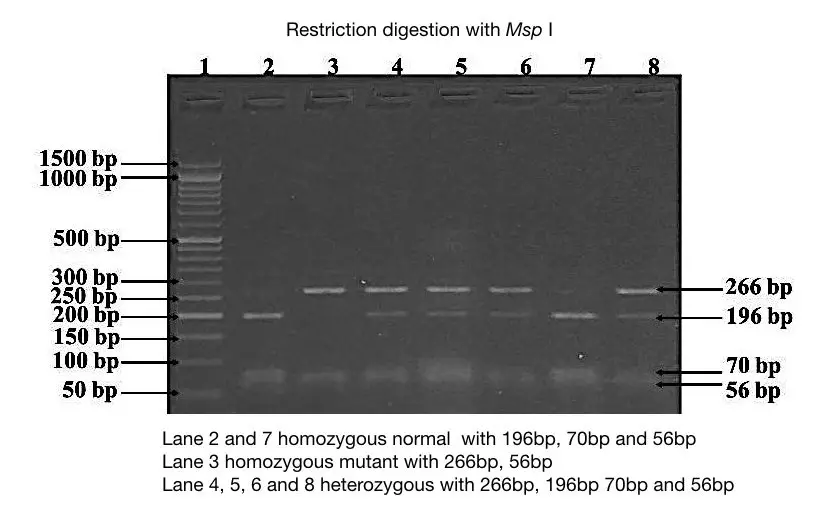
This gel image is a bit different, here the endonuclease Msp I digest both normal as well as a mutant allele. In the normal allele, it cuts DNA at two different locations and generates three fragments of DNA viz 196bp, 70bp, and 56bp (lane 2 and 7).
While in the mutant allele, it cuts DNA at one location and generates two DNA fragments of 266bp and 56bp (lane 3).
Lane 4, 5, 6, and 8 are heterozygous contain 4 DNA fragments of 266bp, 196bp, 70 bp and 56bp.
Tips: for the identification of restriction digestion gel, first examine whether more than two bands are present or not.
In the next step identify the heterozygous having one extra band than the normal allele and see whether it matches both alleles or not.
Finally, see the overall gel, the DNA bands of restriction digestion agarose gel electrophoresis should be sharpened and thinner than the PCR results.
Now, let us take some examples of multiplex PCR results.
You can read our series of articles on agarose gel electrophoresis:
Analyzing and Interpreting (Agarose) Gel Electrophoresis Results of Multiplex PCR:
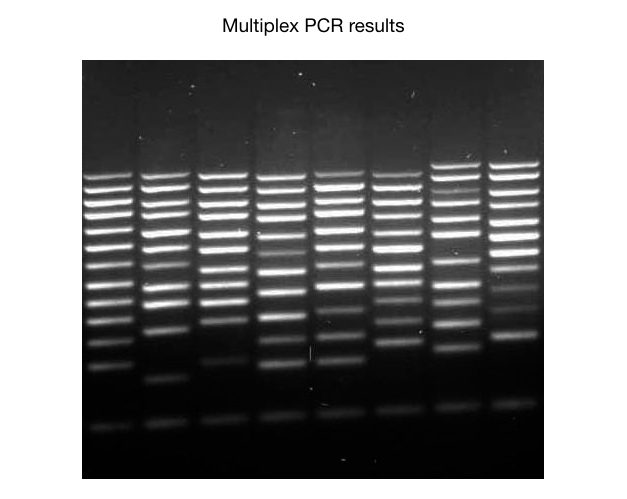
In the multiplex PCR, more than two sets of primers are used to amplify the template or a set of templates which means we will observe more than two bands in a single lane of a gel.
We had covered an amazing article on multiplex PCR, you can read it here: What is a multiplex PCR?
The multiplex PCR saves time and we can run more than two experiments in a single tube that is the main advantage of it.
Image 7:
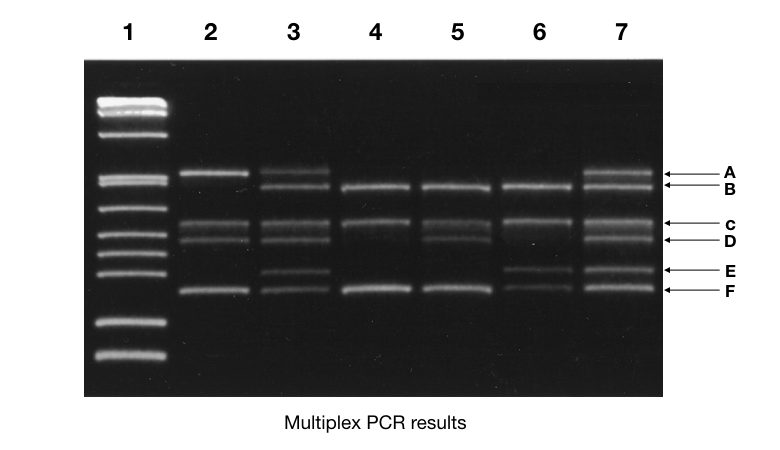 See the figure above,
Seven samples are run on agarose gel electrophoresis for 6 different markers (A, B, C, D, E and F). Marker A is only present in samples 2, 3 and 7, examine the figure. You can analyze all the markers like this and for convenience create a table for each marker.
See the table below,
| 1 | 2 | 3 | 4 | 5 | 6 | 7 | |
| A | M | Present | Present | Present | |||
| B | M | Present | Present | Present | Present | Present | |
| C | M | Present | Present | Present | Present | Present | Present |
| D | M | Present | Present | Present | Present | ||
| E | M | Present | Present | Present | |||
| F | M | Present | Present | Present | Present | Present | Present |
From the table, you can interpret that C and F markers are present in all samples.
Image 8:
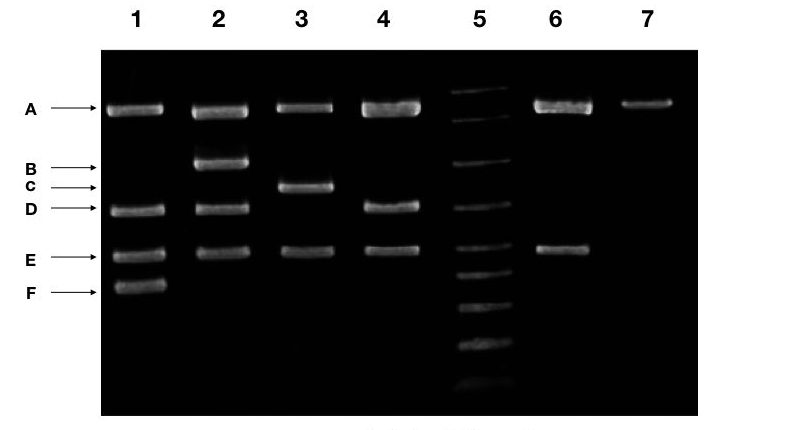
The above image also carries a multiplex PCR results for some marker, by doing the same procedure explained above you can create a table and interpret the results.
[epcl_box type=”notice”]The difference in the band intensity and sharpness is due to the deference of DNA concentration and agarose gel concentration. [/epcl_box]
Image 9:
The gel image 9 is MLPA (Multiplex Ligation-dependent Probe Amplification) results of DMD gene exons. You can read it here: https://www.dmd.nl/DMD_MLPA.html (external link of the article).
The assay is designed to screen exons of the DMD gene. However, we will explain to you DMD in another separate article.
Let’s move to the interesting part of this article.
The different form of DNA has a different migration rate in the agarose gel. Three forms of DNA viz linear, circular and supercoiled are abundantly found in nature.
Analyzing and Interpreting (Agarose) Gel Electrophoresis Results of Different forms of DNA:
Image 10:
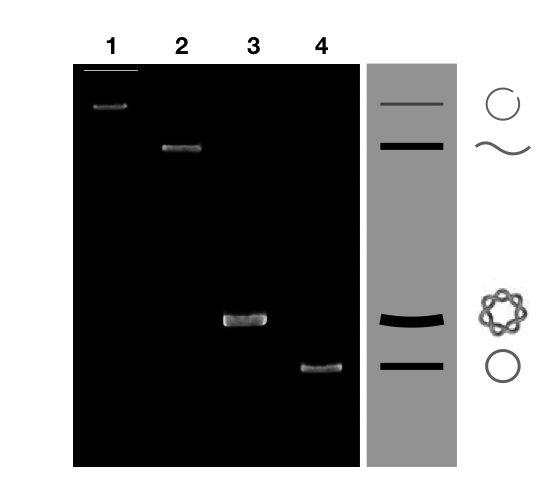
When you run a plasmid DNA on the gel you will probably obtain DNA bands shown above.
The single-stranded circular DNA migrates faster than the other form of DNA. Naturally, the DNA remains in the supercoiled form.
The process of supercoiling is very necessary for fitting DNA inside the cell. However, the supercoiled DNA is not accessible for the replication to done.
For in vivo replication, the topoisomerase cleaves one DNA strand and loosens the tension on it and also serves a free end for the polymerase to work.
In plasmid, this form of DNA (cleaved with the topoisomerase) is a nicked circular DNA that migrates very slower during agarose gel electrophoresis run and appears very nearer to the well. See the lane 1.
The linear form of DNA is generated by cutting it with the restriction endonuclease. It cuts both the plasmid DNA strands at one location and makes it linear.
The linear DNA migrates faster than the nicked circular DNA and slower than the supercoiled DNA. The band of linear plasmid DNA appears between the supercoiled DNA and nicked DNA. See the lane 2 of figure 10.
Another form of DNA is the supercoiled form required to fit DNA inside the cell. The structure of supercoiled DNA is so intact that it migrates faster through the pores of agarose gel. It appears after the band of linear DNA.
The single-stranded circular DNA run faster among all forms of DNA due to the topologically constrained structure of it.
During the plasmid preparation, when we treat the plasmid DNA with the alkaline agents, it becomes single-stranded temporary.
However, when it reached the neutral pH it becomes supercoiled.
The single-stranded circular DNA, often known as a covalently closed circular DNA migrates faster in a gel. See the lane 4 of figure 10.
[epcl_box type=”information”]Note: when you isolate a plasmid DNA, run it on an agarose gel and the band will appear behind the supercoiled DNA band, or not migrate up to the desired distance, it indicates that your plasmid DNA is contaminated with nuclease or DNase. [/epcl_box]
You can read our articles on DNA topology, cccDNA, linear DNA, supercoiled DNA and DNA topoisomerase:
Image 11:
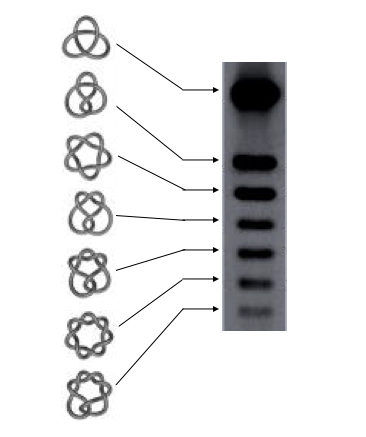
Now this gel image is something very amazing. As the supercoiling increases the DNA migrates faster. When DNA twist increases, subsequently the supercoiling will also increase.
And as the DNA becomes more supercoiled, it becomes more compact and migrates even faster.
Source: DNA knots reveal a chiral organization of DNA in phage capsids.
The laughing DNA bands…
Image: 12
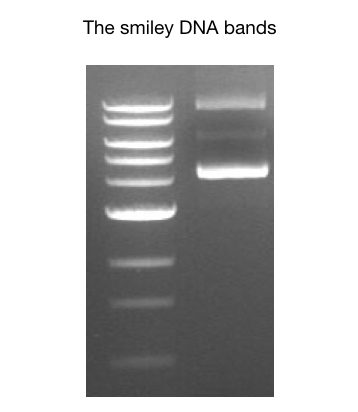
Can you observe something unusual in this gel image?
The bands are clear and sharp therefore the image must be of PCR product. but the bands are curved. These type of bands are called “smiley DNA bands”.
You can observe smiley DNA bands in any DNA whether it is bacterial DNA, human gDNA, PCR product or other DNA products.
Several reasons might responsible for this,
- The thermal diffusion (increase temperature of agarose gel)
- Higher voltage
- Improper agarose concentration
- Reuse of running buffer
Although the laughing bands do not hinder in the interpretation of results. But it is an indication of improper gel preparation.
Read the previous part of this article: A complete guide for analyzing and interpreting gel electrophoresis results.
Conclusion:
The interpretation part of the agarose gel electrophoresis quite difficult if someone is a novice. By reading both the articles of our on agarose gel interpretation you can be an expert in it.
I hope these two articles will help you to understand the gel results.
We are thankful to our friend Dr. Mansi Desai for giving us her gel images of restriction digestion for writing this article.
It quit very interesting and teaching article.