“A computational/graphical representation of nucleic acid separation generated during high throughput electrophoresis is referred to as an electropherogram.”
This article mainly focuses on what is an electropherogram of DNA or RNA and how to read it. The main content would be more technical.
Molecular analysis of DNA or RNA needs powerful subsidiary techniques like electrophoresis or more advanced versions like capillary electrophoresis to interpret results. Without them, downstream processing will not be achieved.
Electrophoresis is tedious and lengthy to perform, and makes the interpretation part more difficult, at a basic level. For instance, a person needs the expertise to analyze agarose gel results but he or she needs even more experience and expertise to analyze PAGE or sequencing results.
Why so?
Because such interpretations are manual, need manual evaluation and powerful eye-sight, thus experience matters!
Automation in analytical procedures allows scientists to do more powerful examinations without requiring extensive physical investigations. Still, experience matters to sign a result paper. Because after all, it’s a computer-generated result. Anyway,
Capillary electrophoresis generated electropherogram has been used not only in the sequencing of DNA but also in DNA analysis, fingerprinting, STR analysis and RNA integrity studies.
Oftentimes, it is also very difficult to interpret the results of electropherograms, especially for sequencing, for beginners and for an expert too. That’s because of a lack of strong theoretical understanding and more focus on technical aspects only, I personally believe.
So it is important to understand the basics of electropherogram, what it is, what the peaks show and on which principle it works. This understanding will also help other students too, who still do not use any of these techniques but know about basic electrophoresis.
I have years of working experience in molecular laboratories. Reading is my hobby so I often read manuals and technical guides of instruments and understand the background.
In this article, using my technical knowledge, I will explain what the electropherogram is, and how to interpret the results. We will also look into the electropherogram of DNA, RNA, sequencing and STR analysis.
Stay tuned.
Key Topics:
What is an electropherogram?
(I genuinely don’t know where to start, because these things are so technical!)
You might see many gel electrophoresis images of DNA and RNA, and even PAGE results. The electropherogram demonstrates similar results in a computer-generated graph. But in a more accurate, precise and robust way.
The instrument generating electropherograms is known as capillary gel electrophoresis. It works on the principle of conventional gel electrophoresis and separates molecules depending upon their charge and mass.
But instead of a gel, the sample runs in small capillaries which are filled with a gel. Each fragment is fluoro-labeled, when it leaves the capillary, the light beam captures a fluorescence emission from the fragment, the detector detects it and the computer generates an image/graph.
Two technical considerations are important to understand here,
- Smaller fragments migrate faster and give a signal first. This helps in the separation of nucleic acid.
- The intensity of the signal is directly proportional to the height of the electropherogram peak. This helps in sequencing the DNA.
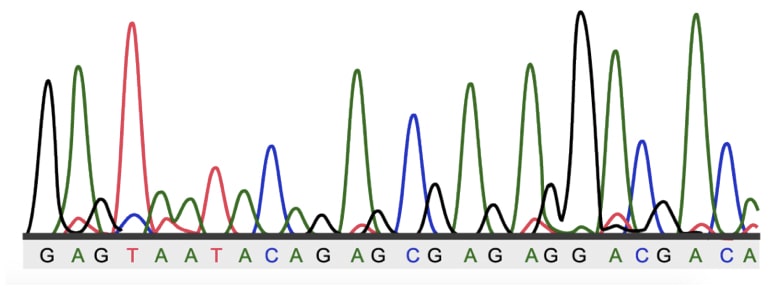
The results look like this
The capillary electrophoresis generated electropherogram gives accurate, sharp and precise results. It can even distinguish a single-base pair change. Furthermore, it lacks tedious and hazardous sample processing.
Due to such advantages, it has been used in the separation of DNA, RNA and even proteins, STR analysis, DNA fingerprinting, DNA sequencing and other sensitive molecular genetic experiments.
Now let us understand the graph.
What is a peak in an electropherogram?
First, see this image.
The whole electropherogram demonstrates many things. It has both axes (X and Y), background noise and peaks. A peak is a crucial property of an electropherogram which shows so many things about the sample.
When a detector detects a light emitted from the fragment, it gives an intense signal to the computer which generates a series of data points for each signal. We named it “peaks”.
- Each peak shows a signal captured for a particular fragment.
- The height of a peak is directly proportional to the fluorescence emitted by the fragment.
- Higher the peak height, the higher the intensity of the signal and vice versa.
- For sequencing, different colored peaks show data for different bases, for instance, red for thymine, blue for cytosine, green for adenine and black or yellow for guanine.
- Peaks are located on the X axis.
- For different experiments, the presentation and interpretation of a peak differ, however, in principle, it shows the signal given by the machine.
- For nucleic acid, separation shows a fragment size.
- For sequencing, it shows a particular nucleotide.
- For RNA, it shows the presence of various RNA species.
- For fingerprinting or STR analysis it shows a particular allele.
Read more: Sanger Sequencing Analysis 101: A Beginner’s Guide to Sanger Sequencing Peaks.
Examples of electropherograms:
DNA, RNA and STR electropherograms are well-known to us. Among these, the results of RNA electropherograms are a bit difficult to study and understand. Let’s understand each, one by one.
DNA electropherograms:
One of the widespread uses of capillary-generated electropherograms is in the separation, differentiation and analysis of DNA. Fragments, alleles and sequences of the DNA can be studied by the electropherogram analysis.
The basic principle relies on separation by electrophoretic mobility. Fragments of DNA, amplicons and alleles are separated based on their size, accurately. Studies show that this technique can enable scientists to study a single base change-SNP (Single Nucleotide Polymorphism).
However, oftentimes, conventional electrophoresis by gel electrophoresis is sufficient enough to study DNA fragments, amplicons and alleles. Sequencing needs an advanced setup like the capillary analysis.
Electropherograms in DNA sequencing:
Originally the capillary electrophoresis technique was developed for powerful sequencing. Electropherograms in sequencing show us each nucleotide present in the sequence. However, the method varies a bit among different sequencing platforms.
In sanger or chain termination sequencing, when the chain terminates by ddNTP, the light beam captures the signal and prepares a peak of electropherogram. Again, the height of a peak shows the intensity of the signal. The Higher the height the better the signal is.
On the analysis side, the computer compares the electropherograms of the sample with the control to identify any sequence change. Nonetheless, sanger can sequence a few thousand base pairs accurately.
Electropherogram of RNA:
Electropherogram of RNA shows the integrity of the RNA sample, usually which is denoted as RIN- RNA integrity number. Before going ahead, let me tell you that I have explained everything about this in our previous article. Click the link to read more.
The actual electropherogram peak shows various RNA species, 18s rRNA, 28s rRNA, 5s rRNA and others. Other regions of the electropherogram also demonstrate the possible contamination and loss of integrity.
STR or fingerprinting electropherogram:
The electropherogram of DNA fingerprint or STR analysis is significantly different from other forms which often need substantially utmost skills to interpret the results. Although, the results are not that complicated.
When we run the STR markers in the capillary, it shows an electropherogram peak for each allele, amplified in the PCR. Scientists can even understand a single base change in allele and differentiate different STR markers based on that.
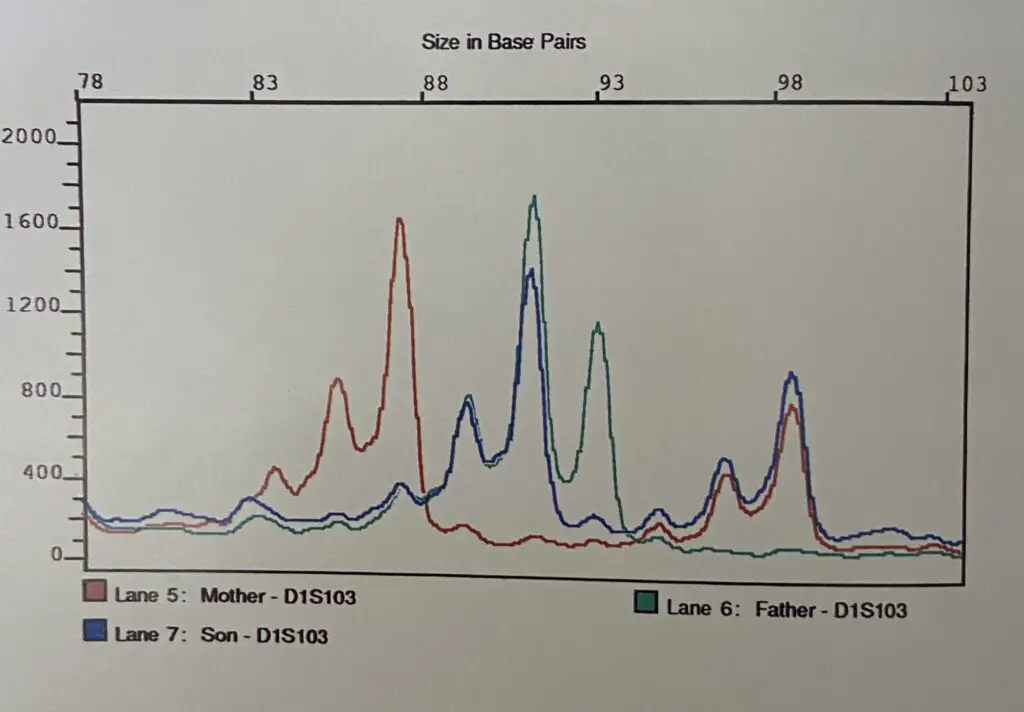
Differential electropherogram patterns show the biological difference in the sample. Check out this image to understand how a particular STR marker electropherogram appears, for mother, father and child.
How to read electropherogram results?
How to read Electropherograms of sequencing?
Now coming to the interesting and important part of this article, how to read it. But more accurately we can say, how to read different electropherograms. Let’s see examples.
This is just a part of large sequencing analysis. Firstly, these are results of sequencing (particularly, Sanger sequencing). Each color peak shows each base in the sequence (red- thymine, green- adenine, black- guanine and blue- cytosine).
Larger peaks show excellent signals and vice versa.
The Results are printed and cross-analyzed against standard results or evaluated by computational software.
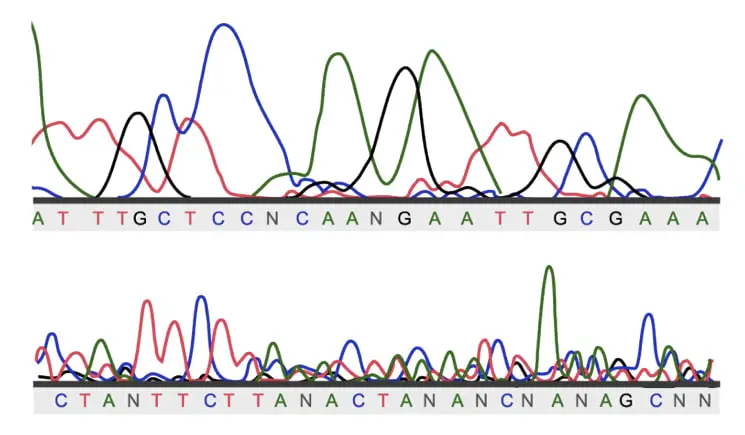
Now this plate is a bit complicated, right? How to read these kinds of results? First, understand it’s a sequencing result but… not so good, I mean bad, actually.
Technically, the signals obtained from the capillary machine are not good. And this is because the preparation, and processing or DNA sample is not good. Such results are read as unambiguous. Repeat sequencing is advisable. Here N denotes a non-identified signal.
How to read an electropherogram of STR and fingerprinting?
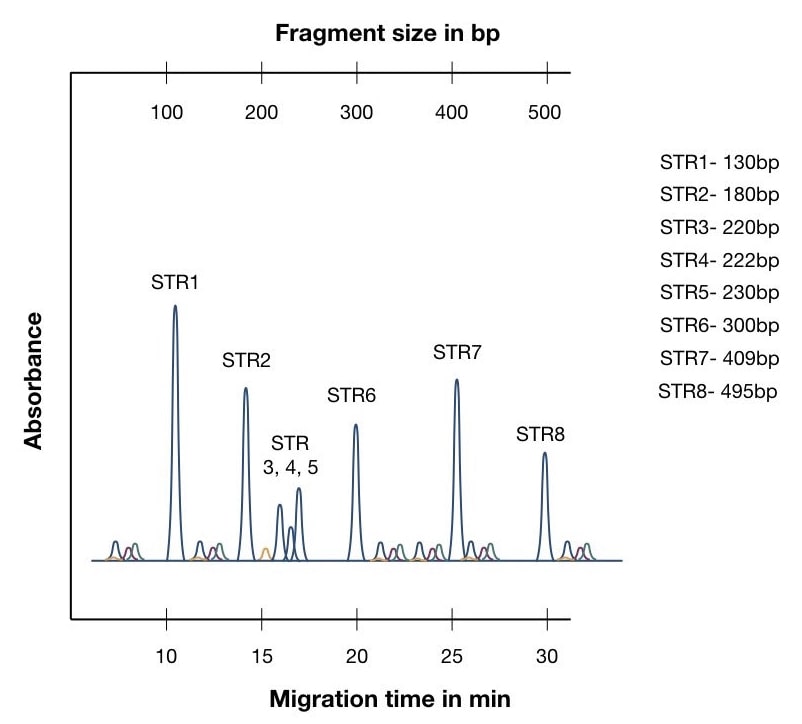
I have generated this image to make you understand. This image is an illustration of STR results.
Ok, so now coming to how to read it.
First, understand the graph, the X axis shows the migration time, and the Y axis shows the intensity of absorbance. Another axis parallel to the X axis shows the size of fragments.
Differences in the color of peaks are because of the different fluorescence dyes used during the separation.
STR1 is a 130bp fragment and completed a run in around 10 minutes while the STR8 is the 495 bp fragment which took around 30 minutes to complete the run. It is important to know that the size of peaks isn’t related to the size of the allele (STR).
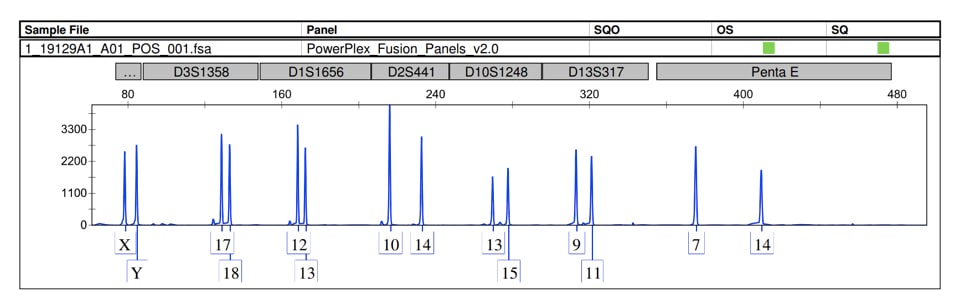
This is another plate of STR analysis showing markers from each chromosome.
How to read RNA electropherogram results?
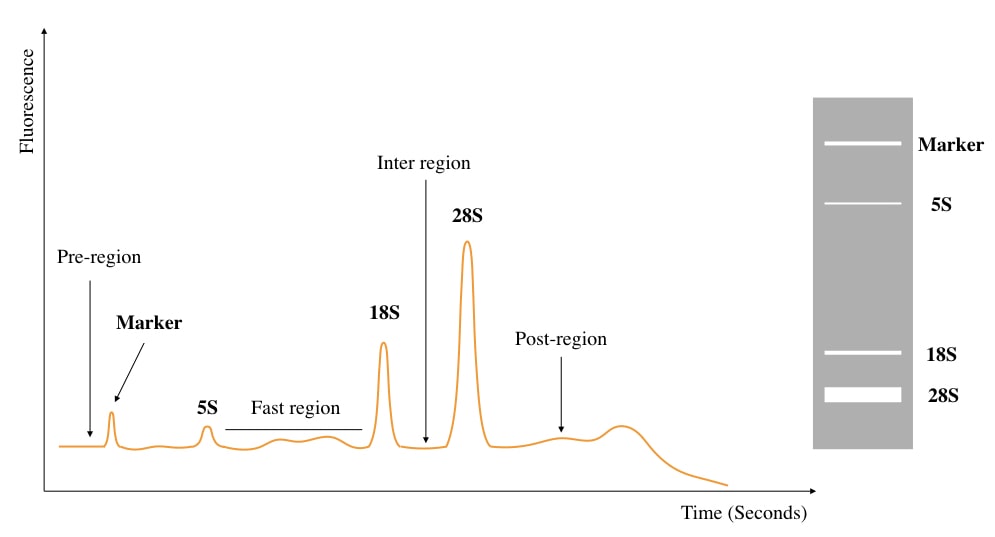
This is a RIN assay for RNA integrity study showing different peaks of electropherograms. To better understand the concept, I have prepared and labeled the image.
The larger peak is 28s rRNA.
The smaller nearby peak is 18s rRNA.
The 5s rRNA region is very near to the marker region and the marker region shows the amount of RNA degradation if any, If you are interested to learn more, you can read our previous article. I have given a link in the above section.
Wrapping up:
“Picture tells a thousand words.”
There is nothing more to discuss here because as aforementioned, the article is so technical. Nonetheless, if you read it comprehensively, It will help you in your future endeavors like sequencing, STR typing and forensic analysis.
Importantly, keep in mind that pre-training and experience are required to interpret and read patients’ sequencing, STR or forensic-typing data.