“Sanger sequencing results are analysed by software. Before starting the electropherogram analysis, explore this complete beginner’s guide to Sanger sequencing results.”
Every Life science students should learn Sanger sequencing!
Sanger sequencing is a gold-standard technique in recent times. It has been extensively used in various biological science fields, the reasons being the simple experimental setup and the results/analysis part.
However, students still face challenges understanding the present concept, particularly the results and evaluation part! In addition, peers from microbiology, environmental sciences, biochemistry, archaeology, zoology, botany, etc face the same challenges.
There are hardly any articles explaining the Sanger results for beginners. Hence, this article serves a basic or beginner’s guide to undertand this aspect of sequencing, even prior to elctropherogram analysis.
Any peer from a life science background can explore this article to gain insight into the basics of Sanger sequencing results.
Stay tuned.
Key Topics:
What is the Sanger sequencing result?
Sanger sequencing reads the nucleotides from a DNA fragment or a gene, and therefore, the results should show the nucleotides in the form of A, T, G and C.
It’s true! It doesn’t provide direct nucleotide sequence! We need to extraction the sequence from the results file.
Types of Results:
The present technique works on the principle of chain termination. The nucleotide is read at the end of each fragment upon chain termination. There are two ways for this.
- Sequencing PAGE gel analysis
- Electropherogram analysis
Sequencing PAGE gel analysis:
The PAGE gel-based sequencing analysis relies on the radiolabeling. It’s a combination of gel electrophoresis and Autogradiography,
In this process, all four reactions are run on the PAGE gel after completion of the sequencing run. Differential banding patterns help understand and interpret the results. In the final step, the picture is analyzed using autoradiography.
I already covered a comprehensive article on how to read a Sanger sequencing gel. You can go and check out that article to learn from it.
This is a traditional, time-consuming, and tedious way to read the sequence. In addition, it’s least accurate, error-prone and depends on the expertise of the evaluator. This technique is not in use now!
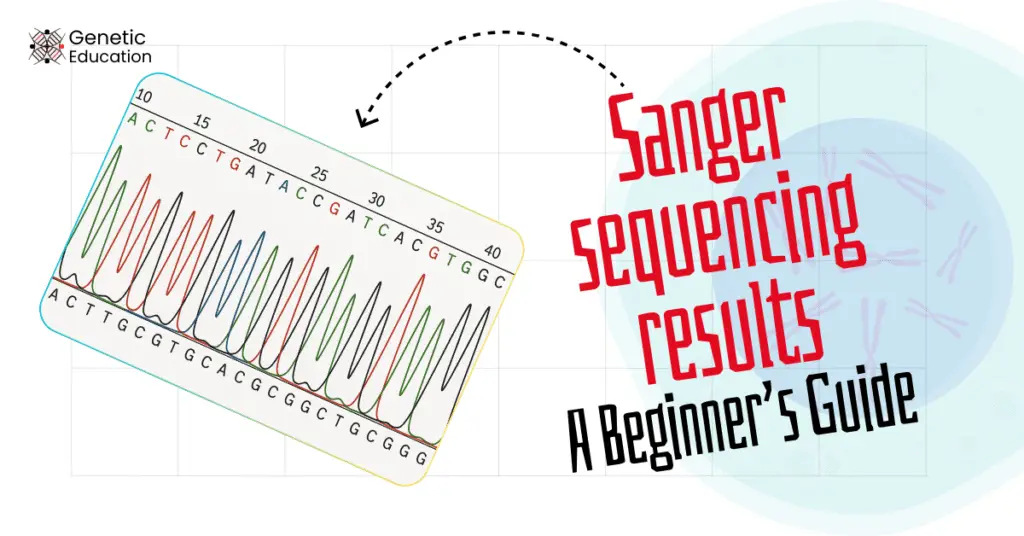
Electropherogram analysis:
Electropherogram or chromatogram analysis is a software-based Sanger sequencing analysis technique. Here, a single file, just like a Word (.txt) or Excel file (.xls), is generated after the run completion.
This file is then run in an analysis software, which prepares the results automatically. However, visual analysis is required for validation purposes. Again! We have already covered the complete guide on how to analyze an electropherogram, you can check it out.
Software-based analysis is popularly and widely used in recent times. In conclusion, your sequencing results are generated in the form of a file! That needs to be opened using software.
Want to know about the file? Let’s move further
Sequencing Files and Formats:
Now you need to understand a bit of informatics! Here, the first priority is, you should have to know about various types of file format and extensions.
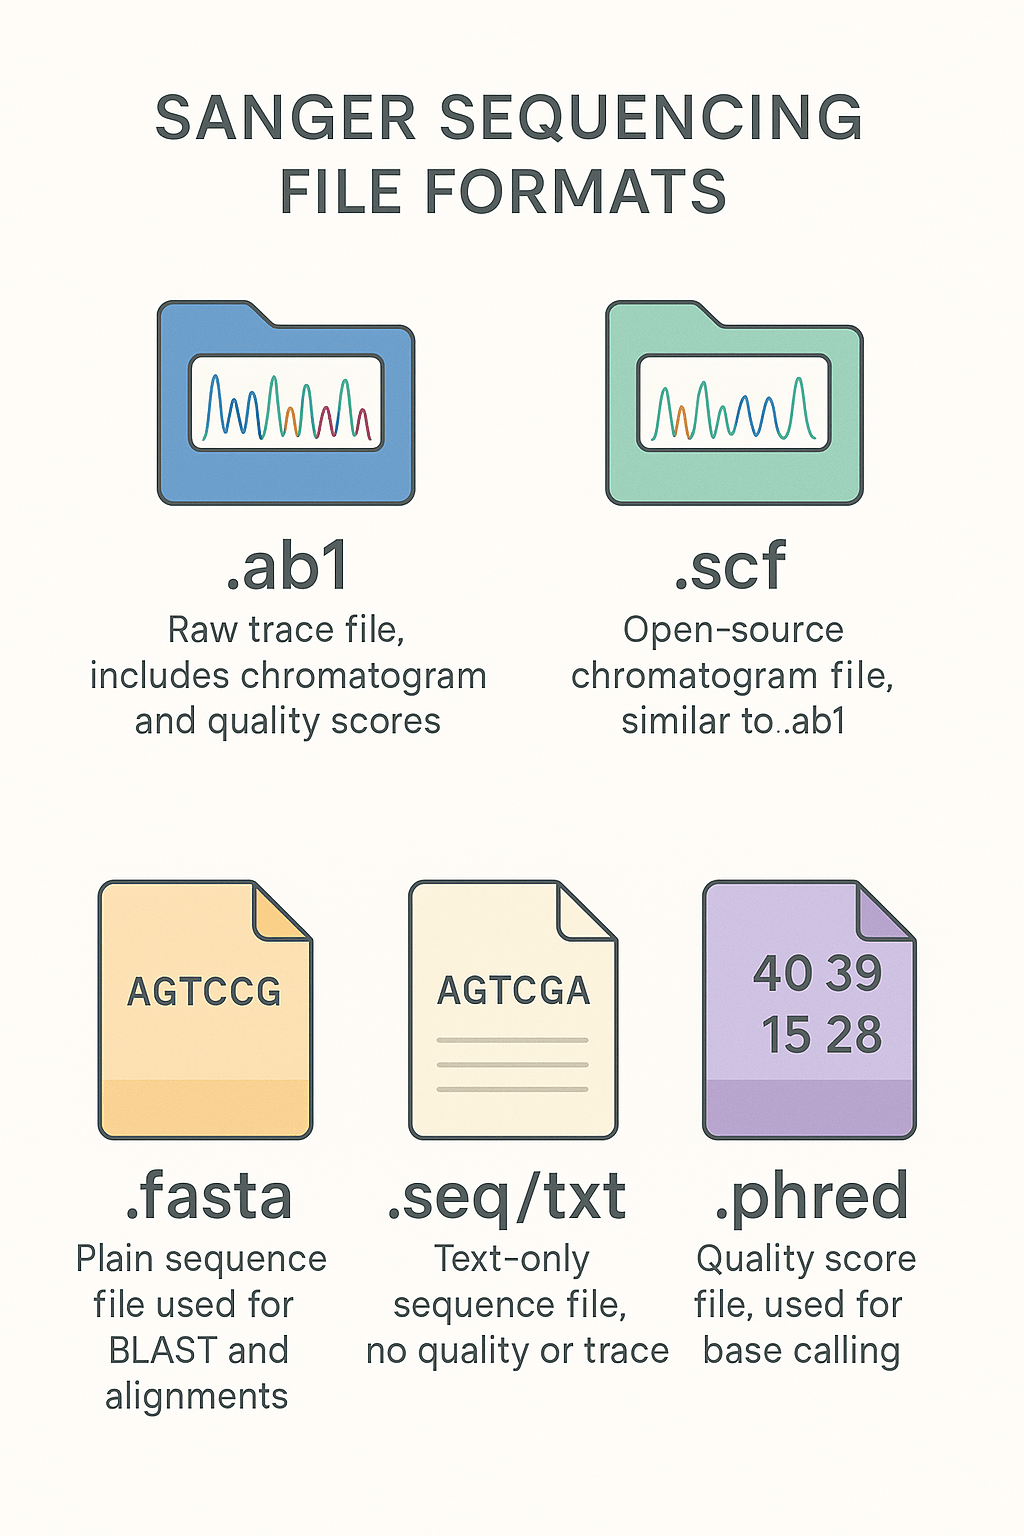
.ab1, .scf, .fasta, .seq and .txt are common file types used during the Sanger sequencing analysis.
.ab1
The present format has been developed by Applied Biosystems, being a pioneer in the sequencing field. Still, it is globally accepted and can be processed by all software.
.ab1 file is considered a raw sequencing file or trace file. So whenever you hear ‘raw file’ or ‘trace file,’ make sure it’s ‘.ab1 file.’ Now, this file contains raw data, base calls, quality score and electropherogram trace.
Common software like 4Peaks, Chromas, or FinchTV can process it and generate the results.
.scf
Once Sanger sequencing became popular and the gold standard, many open-source tools and software have been developed. So, a universally readable file format has been developed, named .scf or sequencing chromatogram file.
This is again a trace file and carries the same information as the .ab1 file. It is supported by tools like SnapGene and BioEdit.
Note:
Both these files show the electropherograms or chromatograms, the base quality, base sequence, base numbers, sequence information in the form of text and dyes used during the sequencing.
.fasta
The present file format is a special type of text-based file, carrying the sequence information in text format. This file has been used for downstream analysis like BLAST, multiple sequence alignment and database submission.
.seq or .txt
The sequencing data can also be exported in the form of a simple .txt file, which is similar to our text file. However, it only carries the sequence as text, no trace, electropherogram or quality information included.
.txt or .seq file is used for bioinformatics or manual sequence assessments.
.phred:
.phred file is generally used for NGS but also employed in Sanger sequencing analysis. This format can open only in the Phred software and is used to assemble and verify the sequence information with high precision.
Pro-tip for Beginners:
Always keep your original .ab1 file safe — it contains all the raw data needed for troubleshooting or re-analysis!
Summary:
| File Format | Description | Contains Trace Data? | Common Use | Opens With |
| .ab1 | ABI sequencer output; standard Sanger file | Yes | Primary file for electropherogram viewing and base calling | 4Peaks, Chromas, FinchTV |
| .scf | Standard Chromatogram Format (open-source) | Yes | Alternative to .ab1, less common now | SnapGene, BioEdit |
| .fasta / .fa | Plain text nucleotide sequence | No | BLAST, alignments, annotations | Any text editor, online tools |
| .seq / .txt | Raw base sequence in text | No | Quick reference, reports | Any text editor |
| .phred | Output from Phred base-calling tool | Quality scores only | Base quality assessment, especially for research pipelines | Phred viewer, command-line tools |
Now, you are familiar with files and formats, let’s move further and know about the software or tools used for sequencing results.
Tools and software:
We are planning a dedicated article on this topic, so here I am giving you some basic information, only in tabular form.
| Software | Free/Paid | Platform | Key Features | Best For |
| 4Peaks | Free | macOS | Clear trace view, base editing, FASTA export, basic analysis | Students, quick checks |
| SnapGene Viewer | Free | Windows/macOS/Linux | View .ab1 files, visualize sequences, plasmid mapping | Teaching, visualization |
| Chromas | Free (Basic) | Windows | Easy navigation, base editing, print-ready electropherogram | Simple editing and viewing |
| FinchTV | Free | Windows/macOS | High-quality trace viewer, export options, easy zoom & scroll | Simple result visualization |
| BioEdit | Free | Windows | Sequence alignment, primer design, file compatibility | Advanced users, multiple format support |
| Geneious | Paid (Trial available) | Windows/macOS/Linux | All-in-one suite: trace editing, alignments, annotation, BLAST | Professional labs, research |
| Applied Biosystems SeqScape | Paid | Windows | For .ab1 analysis, variant calling, supports ABI sequencer data | Clinical, diagnostics, and research labs |
| MEGA (with add-ons) | Free | Windows/macOS/Linux | Phylogenetic analysis, FASTA input only (no trace) | Post-analysis, evolutionary studies |
| UGENE | Free | Windows/macOS/Linux | Supports Sanger traces, alignments, variant calling | Research and bioinformatics labs |
If you want to quickly start your journey and learn sequencing analysis, you can start with the easy software 4Peaks. You can read our complete review and how-to guide on 4Peaks.
Results and analysis process:
We will have all the basic information related to the Sanger sequencing results, Now it is time to understand the process.
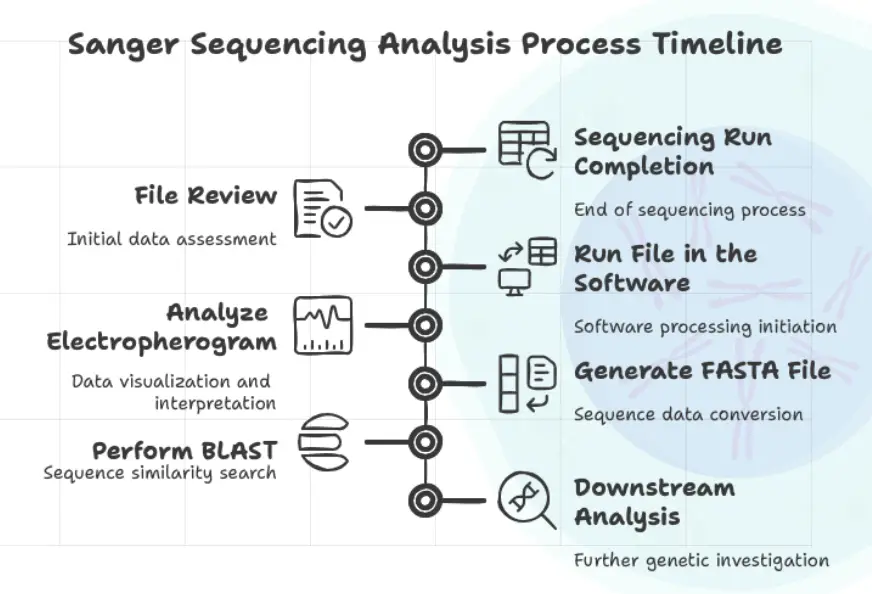
Sample preparation > Sequencing > Sequencing File review > sequence analysis > FASTA > BLAST > Downstream analysis.
Keep in mind that this is the analysis workflow that I made, not the Sanger sequencing workflow, which also includes additional steps like DNA extraction > amplification > purification, etc.
After completion of the sequencing run, the file is prepared and downloaded.
The file review or analysis process is started. Open the file in the sequence viewer software (the list is already given) and start the analysis. Make sure that the chromatogram appears completely.
Soon after, start sequencing analysis, look for the chromatogram- all four color peaks, nucleotides, quality score, FASTA file and other features available. We will cover the comprehensive guide on this later on.
- Perform sequence trimming
- Remove unwanted signals
- Analyze the bases and correct them manually if needed
- Look for an alteration (heterozygous or targeted mutation)
Once the analysis is completed, it generates a FASTA file. A pain sequence information file.
Perform BLAST from NCBI or directly from the software (several software programs provide a direct BLAST option).
Use the results for downstream analysis.
So this is the complete workflow of how to study and analyze Sanger sequencing results.
Beginners keep in mind:
Lastly, students should have to know these points regarding Sanger sequencing to better understand it.
- Sanger sequencing reads one strand at a time. If both strands are needed, each must be sequenced separately.
- The sequence is read in one direction only (5’ → 3’).
- Forward and reverse primers generate two separate reads—both can be used to confirm or correct the sequence.
- Only a part of the DNA is sequenced, not the whole gene or genome.
- Raw files (.ab1, .scf) must be saved carefully—they are crucial for rechecking or troubleshooting later.
- Always check for read quality—bad peaks or mixed signals may lead to wrong interpretations.
- Short (~500–800 bp), clean reads are ideal—Sanger isn’t suitable for sequencing long fragments.
- FASTA files are just text files of the final sequence—no quality data is included.
- Not all tools support all formats. Choose the correct software for your file type.
- Start with free tools like 4Peaks, FinchTV, or Chromas for learning and practice.
Wrapping up:
Sanger sequencing is the most versatile, crucial and extensively used assay in genetic research and diagnosis. The new-age sequencing instrument is equipped with an in-built analysis system, powerful enough to do automated analysis.
However, the free tools can also precisely generate the chromatogram and with resolution. I hope you learn the basics of Sanger sequencing results. In the next article of this series, we will look into the actual electropherogram or chromatogram and understand it.
Till then, Do share and subscribe to Genetic Education. Participate in our Weekly live classes for free or enroll in our Sanger sequencing course now!